

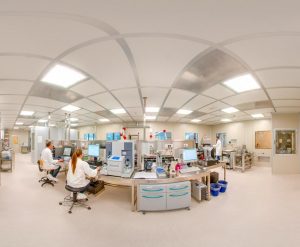
JRC Nanobiotechnology Laboratory
European Commission’s Joint Research Centre (JRC) in Ispra, Italy
The European Commission’s Joint Research Centre (JRC) provides independent, evidence-based science and knowledge, supporting EU policies to positively impact society. The JRC has six sites in five European countries: Brussels and Geel in Belgium, Ispra in Italy, Karlsruhe in Germany, Petten in the Netherlands and Seville in Spain.
The Ispra (Italy)-based JRC Nanobiotechnology Laboratory offers state-of-the-art facilities for interdisciplinary studies with a special emphasis on the characterisation of nanomaterials, nanomedicines, advanced materials, and micro(nano)plastics.
The JRC Nanobiotechnology Laboratory team is a multidisciplinary team of scientists, including chemists, physicists, biologists, and materials scientists with extensive experience in the fields of physical-chemical characterisation of materials and nanobiosciences.
The JRC Nanobiotechnology Laboratory offers extensive facilities and instruments to support the development and characterisation of advanced materials with particular emphasis on nanomaterials and nanosystems.
Access to the Joint Research Centre (JRC) is subject to special conditions and requirements that are summarized in the document Information for CERIC users requesting access to the JRC. Please read the document before requesting access to the JRC Nanobiotechnology Laboratory through CERIC open access Calls for Proposals.
Here below a comprehensive list of the instruments offered at JRC Nanobiotechnology Laboratory.
SEPARATION AND CHARACTERISATION OF NANOMATERIALS AND PROTEIN CHARACTERISATION
ICP-MS allows measuring elements (metals and several non-metals) at trace levels. Dissolved sample is introduced into an argon plasma where the molecules are dissociates and further ionized. Singly-charged ions thus formed are directed into the mass spectrometer. A special application of ICP-MS (spICP-MS) allows measuring size and number concentration of a particle suspension. This technology couples the use of an ICP with MS for elemental analysis by generation of ions. It can also detect different isotopes of the same element, making ICP-MS a versatile tool in isotopic labelling. In a typical analysis, samples consisting of dissolved elements are converted into a fine aerosol by pneumatic action of a flow of argon gas which smashes the liquid into tiny droplets. The droplets thus formed are conveyed in a continuous way into a spray chamber, which allows the smaller droplets (<10 µm) to enter the source of ionisation (the inductively coupled plasma). An inductively coupled plasma is a plasma that is energized (ionized) by inductively heating the gas with an electromagnetic coil, and contains a sufficient concentration of ions and electrons to make the gas electrically conductive. Once in the plasma, the aerosolized sample is dried, its molecules are dissociated and finally ionized by removal of an electron. The singly-charged ions thus formed are conveyed through a series of cones into a mass spectrometer, usually a quadrupole, which rapidly scans the mass range. At any given time, only one mass-to-charge ratio will be allowed to pass through the mass spectrometer from the entrance to the exit. Finally, detector receives an ion signal proportional to the concentration of the analyte in the sample. Quantification is made possible through a calibration curve of the reference material (e.g. pure element). A special application of ICP-MS (single particle ICP-MS) allows measuring size and number concentration of a particles suspension. Suspensions of particles are introduced to the plasma in the same way as dissolved solutions but must have such a concentration as to allow one particle at the time to enter the plasma. As the droplets are desolvated, the resulting particles are ionized producing a burst of ions (one ion cloud per particle). The ions then pass into the quadrupole and the detector generates individual high intensity pulses. Each pulse originate from a particle and, assuming a spherical geometry, its intensity is proportional to the diameter.
The AUC is used to measure the size distribution of nanoparticles and macromolecules in suspension. The instrument performs well in the size distribution measurement of small nanoparticles from proteins and other macromolecules to viruses, liposomes and inorganic submicron particles. The technique measures sedimentation speed of particles in a liquid under the gravitational force generated in an ultracentrifuge. AUC detects light extinction and/or refractive index change and calculates equivalent sphere diameters applying the Stokes equation. As the calculation is based on first principles, no size calibration is needed. Sedimentation coefficient distributions calculated from interference measurements can be transformed to mass based distributions needing only density as input parameter. The particle suspension is loaded in a sample holder with transparent optical windows. Reference liquid (solvent) is loaded in the adjacent cell of the sample holder. Sample holders are placed in a rotor and sedimentation of the particles in the applied gravitational field (at a rotation speed in the range of 1100-50000 rpm) is monitored by interference and/or absorbance optics. The size distribution of floating particles, like lipid nanocarriers or liquid droplets in emulsion can be calculated from their floatation speed. Density of particles can be determined by a series of measurements in various density liquids (sucrose solution, D2O/H2O mixture).
The AFFF instrument separates nanoparticles according to their size in a liquid flow. The instrument can be on-line coupled with various concentration (UV-Vis, RI) and size measurement (DLS, MALS) detectors as well as with a fraction collector. In this instrument, a thin, flat channel is sandwiched between two walls, one of which is solid and the other which is made from a membrane through which water can be pumped. When a liquid containing different sizes of nanoparticles passes through the channel, careful control of the liquid flows along the channel and across the membrane can be used to separate the particles depending on their size, usually with smaller particles exiting the channel first. Size measurement of the separated fractions using on-line coupled DLS or MALS detectors allows a more precise determination of particle size compared to batch mode light scattering based methods by avoiding the misleading effect of strongly scattering, large particles. The typical working range is <500 nm (steric elution range, where larger particles start to travel faster and elute first from the column). The instrument usually performs well for negatively charged and PEG coated nanoparticles or in the presence of detergents or stabilisers that help to minimise the interaction with the semi-permeable membrane wall of the channel. Fraction collector allows the analysis of separated size fractions by methods like TEM that are not compatible with direct on-line coupling.
DCS is able to separate particles or agglomerates of particles according to their mass (size and density) by sedimentation in a liquid density gradient. Size of the particles is calculated from their sedimentation time. The Disc Centrifuge measures particle size distributions using centrifugal sedimentation within an optically clear, spinning disc that is filled with a density gradient fluid (typically sucrose solution). The method measures particle size typically in the range of 0.01 micron to 40 microns (depending also on density). The system works with an excellent resolution, but it is the most performing for particles between 0.02 and 10 microns (depending also on optical properties and concentration). Equivalent spherical particle size (Stokes diameter) is calculated from sedimentation time considering particle density using the Stokes equation. The concentration of particles at various measurement time points is determined by measuring light extinction near to the perimeter of the rotating disc. Mie theory is applied by the instrument’s software – using particle refractive index and absorption as input parameters – to convert light extinction based particle size distribution to mass based distribution. Number based distribution is calculated by the software considering spherical shape and material density.
Dynamic light scattering (DLS), is a powerful tool for investigating the diffusion behaviour of macromolecules or particles in suspension. It gives an estimate of the size of the particles by means of mathematical relations between light scattering and diffusion behaviour of particles. Dynamic light scattering (DLS) is a technique that can be used to determine the size distribution of small particles in suspension or macromolecules in solution by means of mathematical relations between light scattering and diffusion behaviour of particles. In the basic setup of a DLS instrument, a single frequency laser is directed to the sample contained in a cuvette. When light hits small particles in random Brownian motion, the light diffuses in all directions and the scattering intensity fluctuates over time. The scattered light is detected at a certain angle over time and this fluctuating signal is used to determine the diffusion behaviour of the particles which derives from an autocorrelation of the intensity trace recorded during the experiment and is directly correlated to the size of the particles (or more precisely to the particles’ hydrodynamic radii): bigger particles diffuse slower than smaller ones. The output of a DLS size measurement is a light intensity-based distribution that can be converted to a mass or volume one by means of Mie theory. The main advantage of the technique is the detectable particle size that ranges from less than one nanometer to few microns. Moreover, any surface effect (such as organic coating or electrical charge variation) can be analysed by DLS.
Multiangle light scattering (MALS) is a technique that measures the light scattered by a sample at a range of angles. It is used for determining both the absolute molar mass and the average size of molecules in solution. The MALS instrument is in most cases used as a flow-mode detector coupled to Asymmetric Flow Field Flow fractionation (AF4) or Size Exclusion Chromatography (SEC). In a light scattering measurement, a laser beam illuminates a solution containing a suspension of macromolecules or nanoparticles. The electric field of the polarized light beam is produced perpendicular to the plane in which the intensity and angular dependence of the subsequently scattered light is measured. The overall intensity carries information about the molar mass, while the angular dependence within the horizontal plane carries information about the size of the analyte. Coupling MALS with an in-line concentration detector following a sample separation technique such as AF4 or SEC allows determining the molar mass of the eluting sample in addition to its root-mean-square radius. AF4-MALS is applicable to a wide range of analytes including proteins, polymers, viruses, gene vectors, liposomal drug nanoparticles, engineered nanoparticles, colloids and nanoemulsions.
The Brunauer-Emmett-Teller method can be applied for determination of the specific surface area of a solid material. The volume specific surface area of a particulate material might be the basis of a decision whether it is considered to be nanomaterial according to the European Commission’s Recommendation on the definition of nanomaterial. The BET technique uses adsorption of an inert gas (in our case nitrogen) to measure the outer and inner surface area of a solid sample. The sample has to be heat and vacuum pre-treated to remove the adsorbed molecules (mainly water) that might occupy the surface. After the pre-treatment procedure the sample is transferred to the measurement position. As the inert nitrogen and solids interact weakly, the solid material is cooled to the temperature of liquid nitrogen and kept under isothermal conditions during the whole measurement. The pressure of the nitrogen gas is increased gradually and a monolayer of adsorbed nitrogen molecules is built on the solid surface. The number of gas molecules in the formed monolayer is determined from the adsorbed gas volume. The “footprint” of the nitrogen molecule on the surface is known and the total surface area of sample can be calculated by using the BET equation. The mass specific surface area [m2/g] is derived from this total surface by dividing it with the mass of the sample. Multiplying this value with the skeletal density of the material [g/cm3] provides the volume specific surface area of the material. Nitrogen adsorption measurements can provide information not only on the external surface area but also on the porosity of samples. Specific surface area affects functional properties of many different type of materials, including pharmaceuticals, catalysts, structural components.
The cryogenic mill is a freezer combined with a mill. Sample vials are pre-cooled before grinding and continuously kept at low temperature in a liquid nitrogen bath. Samples are pulverised by a steel impactor magnetically shuttled back and forth against the stainless steel end-plugs. Impact rate is adjustable, pre-cooling time and cooling cycles with pauses (that allow to keep the sample at low temperature) can be programmed. The closed vials can accommodate 0.1-5 g material. Applications include grinding of polymers, plant/animal tissues, food, textiles. Typical sample weight is 2 g for biological samples, 1 g for polymers in small vials with volume of about 25 mL. The instrument can host four small vials contemporarily. Starting material pieces have to be small enough to circulate inside the vial as the impactor moves back and forth (max 5 mm).
The instrument enables the controlled and precise assembly of lipid nanoparticles (LNP) using microfluidic technology. It allows formulating at the bench scale small volumes (1 to 10 mL) of LNP in a very reproducible manner, which is of outmost importance for preclinical medicine development. Furthermore, achieving this at low volumes minimizes the use of active pharmaceutical ingredient (API) and excipients, which may be limited in availability, expensive to acquire or laborious to produce. The use of the LNP synthesiser ensures the conditions of self-assembly remain consistent throughout a single formulation and between individual formulations.
The LNP synthesiser enables to formulate also other type of nanoparticles such as liposomes, which can be composed of a variety of lipids loaded with hydrophobic drugs, hydrophilic drugs, proteins, peptides or nucleic acids. Microfluidic preparation of liposomes using the LNP synthesiser allows for rapid production and optimization of formulations compared to thin-film hydration. Consistent process conditions afforded by non-turbulent mixing of solvent and aqueous phases ensures consistent results, removing user-to-user and batch-to-batch variability.
Nanoparticle Tracking Analysis (NTA) is a method used to determine the number based size distribution, concentration, and aggregation state of nanoparticles in suspension. The basic setup of an NTA instrument involves illuminating a sample with a laser and capturing the scattered light using a camera. The movement of individual particles is tracked over time, allowing for the calculation of their size based on their Brownian motion. The technique is capable of detecting particles in the range of 30-1000 nanometers in diameter depending also on light scattering properties.
Our instrument is equipped with a 405 nm laser, corresponding filter for fluorescence detection and peristaltic pump assisted sample injection system. It operates with aqueous suspensions. The minimal sample volume needed is 1 mL. Optimal concentrations typically range from 10^7 to 10^9 particles/mL, depending on the specific application and sample material.
The technique is based on a self-reference interferometric measurement of the scattered wavefront in the forward direction by a single illuminated particle. When a suspension is forced to pass through the waist region of a tightly focused laser beam with a laminar fluid flow, the extinction cross section and the polarizability are retrieved for each single particle that are detected and counted. From the 2D histogram, it is possible to identify, select and analyse separately particle populations that can be present in the sample. Accordingly, SPES distinguishes between particles and components of complex matrices of various origin (biological, industrial or environmental). For each single measured particle, SPES provides more independent parameters, allowing to: i) distinguish particles of different composition, ii) determine actual size distributions, iii) retrieve information about shape/aspect ratio, iv) control stability/wettability, v) monitor the presence of and characterise aggregates and vi) characterise the contaminants in fluids. Additionally, the software includes tools for implementing sample analysis such as the Principal Component Analysis and the average filling factor calculator. The instrument is able to work independently or in continuous flow analysis, for example if coupled as a detector with other instrumentation (for instance, asymmetrical or centrifugal field flow fractionation
In this instrument, particle size distribution of materials is determined by measuring the intensity of light scattered to different angles as a laser beam passes through a sample dispersed in a liquid. Intensity data registered by multiple detectors at various angles are then analysed to calculate the size distribution of the particles. Our instrument uses a stirred, 6 mL volume measurement cell for liquid samples, and is equipped with both red and blue lasers to cover a large particle size range. The sample cell is compatible with water-based suspensions, but also with some solvents such as ethanol or isopropanol. The instrument software controls the system during the measurement process and allows the analysis of light scattering data to calculate a particle size distribution. The size distribution calculations require input on optical properties and on particle shape and result in volume weighted distribution results. The software allows to transform this to number weighted results – if density of the particles is known.
In Centrifugal Field Flow Fractionation the applied separation force is centrifugal field. In this instrument a thin, flat channel is sandwiched between two stainless steel walls and mounted on the perimeter of a fast rotating disc. When a liquid containing different sizes of nanoparticles passes through the circular CF3 channel, careful control of the centrifugal field allows to separate the particles depending on their size (or density). Heavier (larger or higher density) particles are forced more to the direction of the outer wall, resulting in smaller (lower density) particles exiting the channel first. If particle density is known, particle size can be calculated from the elution time.
In-line size measurement of the separated fractions using coupled dynamic light scattering (DLS) or multi angle light scattering (MALS) detectors allows a more precise determination of particle size compared to batch mode light scattering based methods. The instrument usually performs well in the presence of detergents or stabilisers that help to minimise the interaction between the particles and the channel wall. Fraction collector allows the analysis of separated size fractions by methods like TEM that are not compatible with direct on-line coupling.
Enhanced Dark Field microscopy (eDFM) enables direct optical observation of several nanoscale materials, with different physicochemical properties, in solution, tissues and matrices. Moreover, non-fluorescent live cells and pathogens can also be easily detectable at a high detail level compared to traditional optical imaging techniques. This high-performance capability provides users with high resolution images of a wide range of material such as:
- Noble metals particles (Au, Ag) down to 10–20 nm
- Metal oxides (TiO2, Fe2O3, ZnO2) down to 20–40 nm
- Polymeric particles down to 40–60 nm
- Lipid nanoparticles down to 80–100 nm
The use of labels and special markers or other specific sample preparation are not required before imaging.
eDFM system works by coupling the source of illumination directly to a special condenser. Thanks to a unique optical light path design, the sample is focused with a maximum photon density, bypassing the objectives, to reduce signal to noise ratio (SNR) and to amplify the particles’ scattering on a dark background. This technique can also be combined with a hyperspectral imaging system to directly measure spectral changes ensuring the discrimination between chemical and biological entities.
At the Joint Research Centre (JRC) Ispra, eDFM is used to characterise the hydrophobicity of several nanomaterials including nanoplastics and liposomes and to detect a wide range of virus like particles (VLPs) and study their interactions with various receptors.
MATERIAL CHARACTERISATION AND SURFACE ANALYSIS
X-ray photoelectron spectroscopy (XPS), also known as electron spectroscopy for chemical analysis (ESCA), is a surface sensitive technique, based on the photoelectric effect, used for analysing the surface chemistry of a material. XPS provides information on the elemental composition, empirical formula, chemical state and electronic state of the elements within a material. XPS belongs to the family of photoemission spectroscopies in which electron population spectra are obtained by irradiating a material with a beam of X-rays. Material properties are inferred from the measurement of the kinetic energy and the number of the ejected electrons. XPS requires high vacuum (residual gas pressure p ~ 10−6 Pa) or ultra-high vacuum (p < 10−7 Pa) conditions, although ambient-pressure XPS instruments, in which samples are analysed at pressures of a few tens of millibar are also available. XPS can identify and quantify the elements present on a surface (elemental composition), their chemical states (chemical shift) and their electronic states. Moreover, XPS can be used in line and area profiling of an element across the surface or in depth profiling when coupled with ion beam ( Ar+, Arn+) etching. Moreover, analysis at low (~120K) and high temperature (~ XPS can detect all elements, except hydrogen and helium, with a practical detection limit of part per thousand (0.1 – 1 % atomic), although sensitivity of part per million can also be achieved. The usual analysis time range between 1-20 minutes depending upon the sample elemental composition. The energy resolution routinely achieved in a laboratory instrument is ~0.5 eV. XPS is routinely used to analyse inorganic compounds, metal alloys, semiconductors, polymers, elements, catalysts, glasses, ceramics, paints, papers, inks, woods, plant parts, make-up, teeth, bones, medical implants, bio-materials, coatings, viscous oils, glues, ion-modified materials and many others.
Time-of-flight secondary ion mass spectrometry (ToF-SIMS) is a surface sensitive technique employed to the detection of molecular ions with mass-to-charge ratios ranging from m/z 1 to m/z 10,000. Given its molecular specificity, ToF-SIMS can provide chemical images with a lateral resolution below 500 nm, allowing for visualization of structures and trace chemical residues within very complex samples. Time-of-flight secondary ion mass spectrometry (TOF-SIMS) is a SIMS technique that focuses a pulsed beam of primary ions (e.g. Bin+, C60, Ar clusters) onto a sample surface, producing secondary both positive and negative ions in a sputtering process. The acceleration of secondary ions into a “flight tube” allows their mass determination by measuring the exact time at which they reach the detector (i.e. time-of-flight). The analysis of such ions provides elemental and molecular information of the sample surface with sensitivity down to ppm (femtomole). When the primary beam is rastered across the surface a spatially resolved chemical image map of that surface can be obtained. Moreover, coupling Cs+, Arn+, C60+ beams with the primary beam allows removing surface layers while monitoring the elemental or molecular distribution by working in the so-called depth profile mode. By combination of the high lateral resolution images and the depth profiles, 3-dimensional chemical reconstructions of microstructures are possible. ToF-SIMS can be applied to almost all type of samples including, conductors, semiconductors, insulators and biological materials.Due to large data sets, Multivariate Analysis (MVA) methods are usually employed to analyse ToF-SIMS data.
X-ray diffraction analysis (XRD) is a technique used to determine the crystallographic structure of a material. Different holders can accommodate samples both in powder and thin film form. X-ray diffraction (XRD) characterization is a powerful non-destructive technique for characterizing crystalline materials. It provides information on crystal structure, phase, preferred crystal orientation (texture), and other structural parameters, such as average grain size, crystallinity, strain, and crystal defects. The components of commercial XRD instruments – an X-ray source, a sample holder and an X-ray detector – are mounted on a goniometer that is able to move their position at various angles with respect to the horizontal plane. In a typical XRD measurement, monochromatic X-rays are directed into the sample, and the intensity of the reflected X-rays is recorded as the source and/or the detector are rotated. X-ray diffraction peaks are produced by constructive interference of a monochromatic beam of X-rays diffracted at specific angles from each set of lattice planes in a sample. The peak intensities are determined by the distribution of atoms within the lattice. Consequently, the X-ray diffraction pattern is the fingerprint of the periodic atomic arrangements in a given material. A search of the ICDD (International Centre for Diffraction Data) database of X-ray diffraction patterns enables the phase identification of a large variety of crystalline samples. Powder X-ray diffraction analytical service is most widely used for the identification of unknown crystalline materials (e.g. minerals, inorganic compounds). Determination of unknown solids is critical to studies in geology, environmental science, material science, engineering and biology. The applications include: characterization of crystalline materials identification of fine-grained minerals such as clays and mixed layer clays that are difficult to determine optically determination of unit cell dimensions measurement of sample purity
TXRF is able to measure the elemental composition of samples (in general for elements with atomic number >12) prepared as a thin film specimen on a polished sample carrier. TXRF is an energy dispersive XRF technique arranged in a special geometry. An incident beam is directed on a polished flat sample carrier at angles below the critical angle of external total reflection for X-rays, resulting in the reflection of most of the excitation beam photons at this surface. The sample, which is typically a film deposited on the sample carrier is hit by the X-ray photons. When X-ray quantum hits an inner shell electron in a (sample) atom, the electron is removed leaving the atom in an excited state. The missing inner shell electron is replaced by an electron from an outer shell. The energy difference between the inner and outer shell is balanced by the emission of a photon quantum (fluorescence radiation). The energy, and therefore the wavelength of the X-ray fluorescence radiation is characteristic for the different chemical elements allowing qualitative analysis. The intensity of the X-ray fluorescence radiation is, in first approximation, proportional to the element concentration allowing quantitative analysis. TXRF can be considered as an alternative to ICP-MS analysis requiring shorter sample preparation times as it does not desire fully dissolved samples. Thanks to the geometrical arrangement, our instrument can also measure powder samples with particle size < 300 µm. The instrument can host up 90 samples for automatized (overnight) measurements. We work with quartz, sapphire or acrylic sample holder discs depending on sample composition.
FTIR stands for Fourier Transform InfraRed, a method of infrared spectroscopy. When IR radiation is passed through a material, some radiation is absorbed by the sample and some passes through (is transmitted). The resulting signal at the detector is a spectrum representing an absorption by molecular vibrations within the sample. The usefulness of infrared spectroscopy arises because different chemical structures (molecules, side groups, functionalities) produce different spectral fingerprints. Fourier Transform Infrared (FTIR) spectroscopy it is one of the most diffused methods of infrared (IR) spectroscopy. When IR light interacts with a sample, a certain portion of the IR radiation is absorbed. The non-absorbed portion passes through the sample (is transmitted) or is reflected. Depending on the instrument set-up, transmitted or reflected light is captured by the detector. Because the portion of absorbed radiation and as well the transmitted or reflected light is characteristic for each chemical substance, the resulting spectrum (intensity of detected radiation across the applied energy/wavelength band) represents a molecular ‘fingerprint’ of the sample. Infrared spectroscopy is therefore a powerful tool for the analysis of chemical structures. For FTIR, an interferometer is applied to extract information about a material placed in the IR beam and the Fourier Transform (a mathematical procedure) results in a spectrum that analysts can use to identify or quantify the substance(s) contained in the sample under investigation. For chemical mapping purposes the IR light beam is usually coupled with a standard microscope set-up (micro-FTIR) provided with reflective focusing lenses and an automatized stage for large areas scanning (e.g. filters for micro-plastic recovery). Special array detectors (focal plane array – FPA) capable of scanning simultaneously several pixels could be also added to the system to speed-up analysis time.
The CRM is a confocal optical microscope equipped with an automatic XYZ stage, that is able to collect the Raman spectrum at each position of the stage. It returns a hyperspectral image, namely a Raman spectrum for each XYZ point in the space. The Raman spectrum is a fingerprint of the molecular structures. The CRM enable to generate chemical tomography of the sample
The CRM is constituted by a “conventional” optical microscope equipped with a 3D automatic positioning stage with resolution < 10 nm in each direction. The light sources are lasers characterized by different operating wavelengths that can be selected individually according to the different experimental requirements. The system adapts automatically the optical configuration to collect the Raman spectra. The instrument in our lab is equipped with 532 nm and 785 nm lasers.
The laser light induces the so-called “Raman effect” in the molecules of the sample, which is reflected in a series of vibrational peaks at wavelengths that are close to the excitation wavelength. The laser excitation light is filtered out by a notch filter and the Raman light collected with a very sensitive spectrometer.
The 3D resolution of the CRM depends on different factors, such as the accuracy of the 3D positioning stage (which is < 10 nm) and the optical system. The instrument is able to detect and identify single sub-micrometric objects in the range of few hundreds of nanometers.
The instrument has numerous applications in the field of material science, biology, forensics, etc. It is considered the golden standard for the characterization of polymers and microplastics. Due to its resolution capabilities it is the only instrument able to identify nanoplastics.
The software is equipped with the most advanced data treatment methods for hyperspectral images, such as Principal Component Analysis. A database with chemical compound and polymers is integrated into the software for the automatic identification of the chemical species.
High Performance Liquid Chromatography (HPLC) is an analytical technique that allows the separation of mixtures of dissolved analytes. The separation principle of HPLC is based on the distribution of the analyte in the sample between a mobile phase (eluent) continuously pumped through the stationary phase of a packed column. Depending on the chemical structure of the analyte, the molecules are retarded while passing the stationary phase and therefore separated. Different constituents of a sample are eluted at different times and leave the column one by one. Once the analytes are separated they need to be identified and quantified in a second step, by the use of a detector coupled with the liquid chromatograph. There are specific detectors, which respond to compounds with determined chemical characteristics. A Diode Array Detector (DAD), for instance, detects those molecules capable to absorb the light in UV to VIS region. In some cases, when the light energy is absorbed by a molecule, it raises some of the electrons to an excited state. When these electrons return to the ground state they emit light. This process is referred to as fluorescence. Fluorescence detectors (FLD) rely on this molecular property for detection. Other molecules can be detected electrically by ionizing them with charged N2 gas after being converted into dry particles (charged aerosol detection-CAD). The larger the particles, the greater the charge. This generates a signal in direct proportion to the quantity of analyte present. All the aforementioned detectors can be used only if a reference material (standard) is available, allowing the comparison of the retention time of the analyte with that of the standard. If the standard is not available, then the identification is difficult, if not impossible. Also sometimes the retention times are misleading and the same retention time does not necessarily mean that the two molecules are the same. In those cases, a mass detector can be used. Several MS detectors, with different technical features have been developed to be coupled with the LC system. All of them are capable to uniquely identify the analyte on the basis of its mass/charge ratio. In particular, the triple quadrupole mass detector (MS-QQQ), is indicated for robust, repeatable and reproducible quantitative analysis of very low concentration of chemicals in complex matrices with the advantage of a very little clean up required.
Additional information
Liquid chromatography requires perfectly dissolved samples. Precipitation of analyte(s) should not occur for the entire duration of the run (independently from the change in composition of the mobile phase)
Non-volatile salts and buffers (e.g. PBS, NaCl) are not tolerated.
Gas Chromatography-Mass Spectrometry (GC-MS) is an analytical technique that integrates two complementary technologies: gas chromatography (GC) for separating complex mixtures of volatile and semi-volatile compounds, and mass spectrometry (MS) for identifying and quantifying the separated components. The process begins with the sample being vaporized and injected into a GC column, where compounds are separated based on their interactions with a stationary phase. The column is heated to optimize separation, with less volatile compounds eluting later. As each compound exits the column, it enters the mass spectrometer, where it is ionized (via electron ionization), fragmented, and analysed by a detector that measures the mass-to-charge ratio (m/z) of the resulting ions. The MS generates a unique “fingerprint” for each compound, enabling precise identification and quantification. GC-MS systems typically achieve limits of detection in the range of parts per billion (ppb) to parts per trillion (ppt), depending on the compound. The instrument available in JRC labs is equipped with electron impact ionization (EI), which is highly sensitive for many organic compounds. GC-MS is indispensable in scenarios requiring high specificity and sensitivity, though it is less suited for non-volatile or thermally unstable compounds (where LC-MS is preferred).
Liquid Chromatography-Tandem Mass Spectrometry (LC-MS/MS) using a triple quadrupole mass spectrometer is an analytical technique combining high-performance liquid chromatography (LC) for compound separation with tandem mass spectrometry for sensitive and selective detection. The triple quadrupole consists of three stages: Q1 (quadrupole 1) filters specific precursor ions based on their mass-to-charge ratio (m/z), Q2 (collision cell) induces fragmentation of selected ions via collision-induced dissociation (CID), and Q3 (quadrupole 3) detects specific fragment ions. This “MS/MS” approach enables multiple reaction monitoring (MRM), where transitions from precursor to product ions are targeted, minimizing background noise and enhancing specificity.
Detection limits vary depending on the analyte, ionization efficiency, and instrument sensitivity but typically range from low nanograms per millilitre (ng/mL) to picograms per millilitre (pg/mL). The instrument in the JRC is equipped with electrospray ionization (ESI).
Pyrolysis–gas chromatography–mass spectrometry (pyGC-MS) is a technique, which thermally decomposes high-molecular weight molecules via heat (600-1000 °C) mediated cleavage in the presence of an inert atmosphere to produce smaller molecules (degradation products) that are separated by gas chromatography and detected using mass spectrometry.
Py-GC-MS generates information on the chemical identity of the analysed sample through characteristic degradation products and fingerprint chromatograms known as pyrograms. (Semi-) quantitative analysis provides information on the mass-content.
PyGC-MS can be used to characterize a variety of materials such as polymers, plastics, rubber, paints, dyes, resins, coatings, cellulose, wood, textiles, oils.
Sample-cups have a filling volume of 70 µL. For suspended sample-materials, the solvent in which the sample is suspended, needs to be removed before pyrolysis. This can be done by evaporation.
Analytes can be enriched by filtration (e.g. from water). Glass fibre filters with a diameter of 15mm can be used for this purpose. These filters are available with a pore size down to 0.7 µm.
Carbon content measurements rely on the quantification of carbon dioxide gas released upon chemical degradation or oxidative combustion of carbon-containing species (e.g. organic molecules, solvents, organic matter, micro- and nanoplastics, carbonates…). Total carbon (TC) content is determined by injecting aqueous liquid samples directly into a combustion oven set at 680°C and filled with a platinum-based catalyst. The catalytic combustion method achieves total degradation and oxidation of all carbon-containing species. TC is then calculated from the amount of CO2 gas released and measured by a nondispersive infrared (NDIR) sensor. Inorganic carbon (IC) (e.g. Na2CO3, NaHCO3) content is determined by injecting aqueous liquid samples into an acid bath (25% H3PO4) which quantitatively converts carbonates into carbon dioxide. IC is then calculated from the amount of CO2 gas released and measured by a NDIR sensor. The total organic carbon (TOC) is finally determined as the difference between total and inorganic carbon as TOC = TC – IC.
NPOC determination combines in situ acidification with hydrochloric acid and sparging of the sample with O2 to eliminate carbonates (IC) and poorly water-miscible volatile species (POC) prior to TC measurement as NPOC = TC – IC – POC.
The TOC analyser can serve as a valuable tool to detect and quantify carbon-containing species (e.g. micro- and nanoplastics, cells, nanocellulose, solvents, organic matter…) in various types of aqueous liquid matrices. As such, TOC can be particularly useful during sample preparation steps (e.g. centrifugation, sonication, filtration, oxidation and digestion…) and following analytical separations (e.g. density separation, AF4, CF3…).
Typical sample requirements for injection in TOC: Homogeneous aqueous solutions and suspensions with a carbon content in the range of 0.01 to 50 mg/L and a volume of about 30 to 50 mL.
Upper particle size limitation for suspensions: Tested up to » 100 μm with PS standards.
Other chemical limitations: Avoid high salt concentrations as well as highly acidic or alkaline samples.
Interferences: Presence of organic compounds (e.g. surfactant, organic buffer, organic solvent, organic matter) at a concentration that cannot be confidently subtracted from the target analyte (e.g. nanoplastics, nanocellulose) will interfere with the results.
AFM is a relatively recent (invented in the 80s) microscopy technique that, in the last 20 years, has become a standard for the morphological characterization of surfaces at the nanoscale. The technique is based on the use of an ultra-sharp tip (with nominal radius of curvature < 10 nm) mounted on a micro-cantilever. A laser and a four quadrant detector is used to monitor with high precision the bending (and hence the force) applied to the tip. In this way, it is possible to gently approach a surface and scan it, measuring the 2-D height profile, hence obtaining 3-D maps of the morphology. Being a very sensitive “force meter” the AFM system can be used in many configurations to measure and map the interaction forces between the tip and the surface (e.g. electrostatic and magnetic forces, friction forces and adhesion, etc.).
Fluid FM uses a special version of the AFM tip, with a hollow tip connected to a microfluidics system and a pump. Using the special controller one can use the tip to spot femtoliters of liquids on a surface, or to inject them in specific location of a cell, or to micro-manipulate cells using a negative air pressure. The Fluid-FM is a unique technique and the one in the JRC labs is one of the first available in Italy.
The instrument is a high-precision, non-contact 3D optical profilometer designed for fast and accurate surface measurement. It utilizes advanced technology to capture detailed topographical data with nanometer height resolution, making it well-suited for a wide range of industrial and research applications. Its compact design and user-friendly interface make it accessible for both novice and experienced users.
The instrument integrates confocal, interferometry, and focus variation techniques within the same sensor head. This innovative design enables fast and reliable measurements, allowing users to efficiently analyse surface topography, roughness, and microstructures. Its versatile capabilities make it a valuable tool for various research areas, such as materials science, biomedical research, thin film analysis, and micro- and nanoelectromechanical systems research. Additionally, it is also applicable in industries such as semiconductor manufacturing, precision engineering, automotive, and medical device production, where quality control and process optimization are crucial.
BIOLOGY AND CELL CULTURE
The benchtop flow cytometer is a highly versatile technique for characterising cell and particle population in particular for their absolute counting.
Flow cytometry (FC) enables to detect and count cells and particles in a given population or dispersion respectively. For the analysis, cells or particles suspended in a fluid flow are transported toward the laser beam that illuminates the sample. The laser beam hits individual particle or fluorescently labelled cell generating a scattered light and fluorescent emission collected by the detectors enabling their counting. In general, for the analysis, single-cell suspension must first be prepared.
Our compact benchtop FC has two light sources and can be used for applications in healthcare, microbiology, quality control or others. Absolute counting of cells, cellular subsets or of other particles is performed in real-time on a volumetric basis.
In vitro cytotoxicity assays allow to study cell biological functions and mechanism such as cell viability, cell growth effects induced by chemicals, advanced (nano)materials. Cytotoxicity in vitro is an important indicator for assessing the effects induced by chemical, nanomaterials or other materials on cells. A broad spectrum of cytotoxicity assays is currently available in the fields of toxicology and pharmacology. There assays can be classify in the following categories: (i) Dye exclusion assays (Trypan blue, eosin, Congo red, …). Determination of membrane integrity via dye exclusion method; (ii) Colorimetric assays: MTT assay, MTS assay (determination of the cell metabolic activity) WST-1 assay (Cell Proliferation and Viability), LDH assay (Cell viability) (iii) Fluorometric assays (alamar Blue assay): Fluorometric assays of cell viability and cytotoxicity are performed with the use of a fluorescence microscope, fluorimeter, fluorescence microplate reader or flow cytometer; (iv) Luminometric assays (ATP assay). Luminometric assays provide fast and simple determination of cell proliferation and cytotoxicity in mammalian cells. When cells damaged lethally and lose membrane integrity, they lose the ability to synthetize ATP and the ATP level of cells decreases; (v) Colony Forming Efficiency (CFE) is a clonogenic assay that measures the ability of a single cell to form a colony: CFE is a labelled free assay and usually more sensitive than the conventional biochemical methods.
The instrument uses the Luminex technology based on magnetic beads for immunoassays multiplex immunoassaysing. The instrument allows multiplex immunoassays by using Luminex coated magnetic beads for the quantification of biological relevant targets e.g. for inflammation, disease, cancer, cell signalling and growth, apoptosis and more. Simultaneous quantification of different proteins and peptide targets is performed using very limited amount of sample (max instrument volume used: 12.5-50 µL). The technology offers high-performance readout, very high sensitivity, enabling to obtain high-quality data from single and limitedlow amount of samples in a very short time respect to conventional ELISA.
Fluorescence microscopy of live cells uses either fluorescent proteins or cell membrane-permeable, non-toxic fluorescent stains to monitor biological processes involved upon ENMs exposure. Fluorescence microscopy, enables to determine the distribution of single molecule specie , its amount and its localization inside a cell and co-localization with other molecules. This can be obtained by attaching fluorescent tags to anti-bodies that binds to targeted features, or by staining cellular structures. The basic function of a fluorescence microscope is to irradiate the specimen with a desired and specific band of wavelength, and then to separate the much weaker emitted fluorescence from the excitation light. In a configured microscope, only the emission light will reach the eye or detector so that the resulting fluorescent structures are superimposed with high contrast against a very dark background. With multiple fluorescence labelling several target molecules can be identified simultaneously. A confocal microscope scans a sample with a focused light beam, and its main feature is the presence of pinholes that are able to exclude photons coming from a different focal plane: the excitation is focused on a specific point of the sample and then scanned in the whole volume. This allows the reconstruction of a 3D image of the sample.
BIOMOLECULAR INTERACTION AND PROTEIN CHARACTERISATION
Non-contact printing is a technology that uses a piezoelectric transducer to create and deposit low volume droplets of samples (i.e. hundreds of picolitres) on a surface without contact. This feature prevents the risks of surface contamination and is very flexible both in term of sample and of surface to modify. In the non-contact printing device, a piezoelectric transducer is used to create low volume droplets of liquid sample that are precisely and accurately dispensed on a surface at defined positions using an X-Y-Z movable stage. Arrays of probes can be printed in a quantified manner, with a high reproducibility from spot to spot and substrate to substrate. The substrate surface is not altered by the printing operation thus allowing the multiple printing using different reagents. This instrument is widely used for DNA and protein arraying applied to biosensor technology.
Quartz Crystal Microbalance with Dissipation monitoring, QCM-D, is a real-time surface sensitive technology that detect mass changes at the sensor surface. In addition, QCM-D also allows to determine the viscoelastic properties of the surface ad-layer by monitoring the energy dissipation. The QCM-D core technology is a piezoelectric unit consisting in a thin quartz crystal disk, embedded between two electrodes. By applied voltage, the crystal can be excited at its proper resonance frequency, which is related to the mass of the quartz crystal disk. Measuring changes of the resonance frequency enables to determine the variation of the mass of material deposited (biomolecules binding) on or removed (biomolecules desorption) from the electrode. In addition, QCM-D measures the energy dissipation, ΔD that provides information on the viscoelastic properties of the electrode ad-layer. This information are particularly useful in the quantification of soft layer properties. Example of applications: – Biosensor development – Biomolecular interactions monitoring – Nanoparticles characterization – Nanoparticles-proteins interaction
Circular dichroism (CD) is a spectroscopic technique that allows the rapid determination of the secondary structure and folding properties of purified proteins. The most widely used applications of protein CD are to determine whether an expressed, purified protein is folded and its thermal stability. CD is an absorption spectroscopy method based on the differential absorption of left and right circularly polarized light. Optically active chiral molecules will preferentially absorb one direction of the circularly polarized light. The difference in absorption of the left and right circularly polarized light can be measured and quantified. UV CD is used to determine aspects of protein secondary structure. In fact, alpha-helical and beta-sheet secondary structures of proteins have specific CD spectra in the 180-260 nm wavelength range, that are very different from unfolded proteins. Using well developed algorithms it is possible to deconvolute the CD spectra of a given protein to estimate the percentage of each secondary structure elements. By following the disappearance of secondary structure while increasing temperature it is possible to measure the thermal stability of the protein and to assess its relative stability in different buffers. CD can also be used to study how proteins change structure and/or stability when forming protein-nanoparticle complexes. The technique is quite sensitive and requires limited amounts of material. It is essential that the buffer system (or other chemical compounds added to the protein sample) uses non chiral molecules, nor has strong absorption in the 190-300 nm wavelength.
Surface Plasmon Resonance instrument enables to detect in real time and without labelling, biomolecular interactions onto the sensing surface.
Surface Plasmon Resonance (SPR) phenomenon occurs when a polarized light impinges a metallic surface at the interface between two media. This induces electromagnetic waves i.e. plasmons, which reduce the intensity of the reflected light at the resonance angle related to the amount of material bound on the surface. In SPR assays, bioreceptor molecules are immobilized on a functionalised gold sensor surface and a sample containing a potential interacting partner in solution is flowed over the surface. During the course of the interactions, the angle corresponding to the minimum of reflected light intensity is monitored. This angle is affected by molecules binding and dissociation providing in real time an interaction profile in the form of a sensorgram.
SPR systems can be used to study interactions involving (in principle) any kind of molecules, from organic compounds to proteins, nucleic acids, glycoproteins, and even viruses and whole cells. Since the response is a measure of the change in mass concentration, the response per molar unit of interactant is proportional to the molecular weight (smaller molecules give lower molar responses). The SPR detection principle does not require any labelling of the target molecules, and measurements can be performed in complex matrices. The measurement can provide information on the concentration of the target in the sample, its affinity for the ligand, on the specificity of the binding reaction and on the kinetics of the interaction.
The Surface Plasmon Resonance instrument enables to detect in real time and without labelling, biomolecular interactions onto the sensing surface. Surface Plasmon Resonance (SPR) phenomenon occurs when a polarized light impinges a metallic surface at the interface between two media. This induces electromagnetic waves i.e. plasmons, which reduce the intensity of the reflected light at the resonance angle related to the amount of material bound on the surface. In SPR assays, bioreceptor molecules are immobilized on a functionalised gold sensor surface and a sample containing a potential interacting partner in solution is flowed over the surface. During the course of the interactions, the angle corresponding to the minimum of reflected light intensity is monitored. This angle is affected by molecules binding and dissociation providing in real time an interaction profile in the form of a sensorgram. SPR systems can be used to study interactions involving (in principle) any kind of molecules, from organic compounds to proteins, nucleic acids, glycoproteins, and even viruses and whole cells. Since the response is a measure of the change in mass concentration, the response per molar unit of interactant is proportional to the molecular weight (smaller molecules give lower molar responses). The SPR detection principle does not require any labelling of the target molecules, and measurements can be performed in complex matrices. The measurement can provide information on the concentration of the target in the sample, its affinity for the ligand, on the specificity of the binding reaction and on the kinetics of the interaction.
The microarray scanner is a laser-induced fluorescence scanner designed to read microarrays printed on standard glass slides. It measures the fluorescence intensity of labelled samples bound to microarrays. The microarray can be based on nucleic acid, peptidic, proteic or any other kind of probes immobilised on the slide.
The microarray scanner measures the fluorescence intensity of labelled sample (nucleic acid, peptidic, proteic or any other type), bound to microarrays. Its ability to measure fluorescence from two dyes simultaneously facilitates all two-color microarray studies. This technology provides for rapid, high-quality, automated scanning of microarrays. The microarray scanner uses two lasers, with excitation wavelenght of 670 and 785 nm. The lasers excite compatible fluorophores (Alexa Fluor (700, 680), Dylight 680 or IRDye 680 on one hand and Alexa Fluor 790, Dylight 800 and IRDye 800) used to label target molecules after binding to the microarray probes. The microarray scanner is optimised for high sensitivity, with NIR lasers to avoid support background and real-time autofocus for a perfect homogeneity across the surface. The dynamic range of measurement allows to detect the lowest signals while avoiding saturation. Fluorescence from the labelled samples is detected in a real-time confocal manner with 2 photomultipliers. The image is acquired in tiff format by the software MAPIX, which also permits the spot quantification.
ELECTRON MICROSCOPY
Transmission electron microscopy (TEM) is a microscopy technique able to analyse ultrathin specimens through which an electron beam is transmitted forming an image. This microscope is used to characterise nanomaterials size and morphology and, if combined with energy dispersive x-ray spectroscopy (EDX), elemental composition. TEM is widely used to study cellular ultrastructure and to identify nanomaterials in complex matrices. The electron microscopy (TEM) is a versatile technique able to identify morphology and primary size distribution of materials at nanometer size and atomic-resolution. It is a major analytical method in nanoscience, physical, chemical and biological sciences and it is considered as a confirmatory technique when combined with other analytical measurements. TEM is based on an electrons’ beam that is transmitted through a specimen with thick less than 100 nm to form an image detected by a digital camera. If coupled with Energy Dispersive X-ray Spectrometry analysis (EDX), TEM is also able to identify the elemental chemical composition of sample. Our instrument includes operating modes such as conventional imaging, scanning transmission electron microscopy imaging (STEM), diffraction, X-Ray spectroscopy, cryo-TEM and combinations of these. At the European Commission, Joint Research Centre, Ispra, TEM is available for the identification of nanomaterials and nanoplastics, to develop and optimise standard methods for nanomaterials’ labelling in complex matrices such as cosmetics and food and for the safety assessment of nanomaterials to contribute to the risk assessment evaluation and nanomedicine.
The Dual Beam SEM / FIB is used for nanoscale imaging, material machining and analysis. It combines ultra-high resolution field emission Scanning Electron Microscopy (SEM) and Focused Ion Beam (FIB) etching and deposition. A scanning electron microscope (SEM) uses a focused electron beam scanning a material surface to produce images at nanoscale. Secondary electrons are thus emitted by atoms excited by the electron beam are detected with characteristics in relation to the Material composition and topography. Typical operation parameters used for Electron imaging are voltage (200 V to 30 kV) and Beam current (< 20 nA). A Focused Ion Beam uses a high energy Gallium ion beam enabling the removal of materials by physical sputtering and materials deposition by introducing specific gas in the vacuum chamber. Machining performances o Minimum deposited line width: 20 nm achievable with electrons and 50 nm achievable with ions beam (Pt). o Minimum etched line width: < 15 nm achievable (Si). o Maximum hole aspect ratio: 10:1 (Si, 500 nm hole radius). Patterning geometries: circles, circular coronas, squares, polygons, possibility to pattern user defines bitmap files, cross-sections. The system is equipped with X-Rays Energy Dispersive Spectrometer (EDS) and a Cathodoluminescence (CL) detector, for correlative compositional and chemical imaging.
Contacts:
Biology and Cell Culture: Sabrina Gioria, Alessia Bogni
Electron Microscopy: Andrea Valsesia, Jessica Ponti
Separation and Characterisation of Nanomaterials and Protein Characterisation: Dora Mehn, Otmar Geiss
Material Characterisation and Surface Analysis: Francesco Fumagalli, Otmar Geiss
Biomolecular Interaction and Protein Characterisation: Cloé Desmet, Andrea Valsesia
Team Leader: Pascal Colpo
More information can be found in the laboratory’s webpage.
-
25.08.2025
Microfabrication Laboratory